


Introduction :
There are different types of gas sensors to detect different gases. Here in this project we are going to use MQ135 gas sensor to sense the pollution content in the surrounding area and then to monitor these values over the Webpage. The circuit consists of a simple connection and takes fewer components to have your own IoT based air pollution monitoring system. In this project, at first, we will be knowing about the MQ135 sensor and its internal circuit.
Later we will be building an air pollution monitoring system using nodeMCU and MQ 135 gas sensor and interface an LCD (16X2) display to nodeMCU, to show the pollution content value. Later on, we will connect the nodeMCU to our LAN, by providing the SSID and password credentials and then we will be generating a webpage where we send the sensor data. The page will be refreshed for every time interval to show the updated values.

COMPONENTS REQUIRED
2. NodeMCU
3. LCD (16X2)
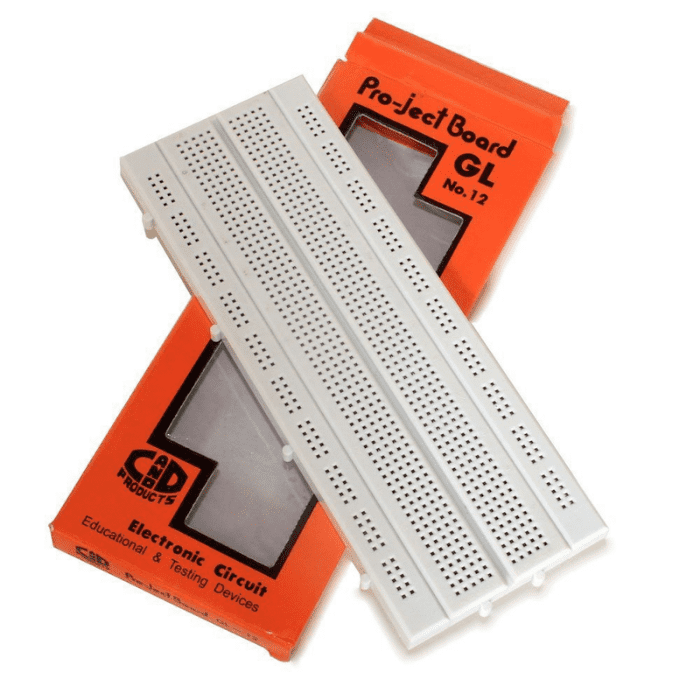
5. Breadboard
Also, read our blog on the Node MCU ESP8266 explaining the NodeMCU ESP8266 board construction, specification, pin diagram, and how to upload programs to ESP8266 NodeMCU.
BRIEF OVERVIEW OF MQ135 SENSOR
The MQ135 sensor is like a variable resistor, whose resistance depends on the gases surrounding it. To sense the gases, the MQ135 sensor contains a gas sensing material that is made up of SnO2. An electrode and electrode line of materials Au and Pt is present in the MQ135 sensor. A heater coil that is made up of Ni-Cr alloy, is used to provide the necessary working conditions for the sensor to work. The MQ135 gas sensor is available in two formats, one in only sensor format and the other in module form.
The difference between them is that the module format sensor contains an extra pin D0 along with an A0 pin, which gives only digital value. To find the ppm or to get the analog value, we will be using the A0 pin. As I am having the module format of the MQ135 sensor, I'm using this module in this project. The MQ135 sensor module contains four pins Vcc, GND, D0, and A0. Their connections will be shown in the circuit diagram section. The internal circuit of the MQ135 gas sensor is shown below.

IOT AIR POLLUTION MONITORING CIRCUIT DIAGRAM
The connections for the MQ135 gas sensor module and 16x2 LCD are shown below. The Vin pin and GND pin of the nodeMCU are connected to the power rails of the breadboard, as shown in the below diagram.
The VCC and GND pin of the MQ135 gas sensor, is connected to the positive and negative rail of the breadboard. Note: Potentiometer’s fixed ends are connected to the positive and ground rail of the breadboard, and its variable end, is connected to the 3rd pin(pin VEE) of the LCD (16X2). The remaining connection for the Lcd to nodeMCU are as follows:
|
S.No |
LCD pins |
Description |
|
1 |
DB4 |
Connected to the D4 pin of the nodeMCU |
|
2 |
DB5 |
Connected to the D5 pin of the nodeMCU |
|
3 |
DB6 |
Connected to the D6 pin of the nodeMCU |
|
4 |
DB7 |
Connected to the D7 pin of the nodeMCU |
|
5 |
LED+ |
Connected to the positive supply terminal of the power rail |
|
6 |
LED- |
Connected to the Ground supply terminal of the power rail |
|
7 |
VSS |
Connected to the ground terminal of the power rail. |
|
8 |
VCC |
Connected to the positive supply of the power rail |
|
9 |
VEE |
Check the above note |
|
10 |
RS |
Connected to the D0 terminal of the nodeMCU |
|
11 |
R/W |
Connected to the ground of the power rail |
|
12 |
E |
Connected to the D1 pin of the nodeMCU |

IOT AIR POLLUTION MONITORING SYSTEM: NODEMCU - ARDUINO CODE EXPLANATION
Here we are using the Arduino IDE to write the code. To write the code for this IoT pollution monitoring project we are keeping in mind that first, our code has to connect the local area network by using the credentials provided in the code. After that, our code has to work on getting the input from the sensor, and then it must display the data on the webpage, which is created using nodeMCU. Please note that we are not dealing directly with the ppm.
We are calculating the voltage variations with respect to the pollution content in the air. If the output voltage of the MQ sensor is less than 20% of the max voltage value, we considered it a normal amount of pollution content present in the air. If the output voltage is increased and stabilizes in the range of more than 20% to less than 70%, then it is considered as a medium amount of pollution content present in the surrounding air. If the output voltage increases more than 70% of the maximum value, then it is considered as dangerous level. These values are transmitted and shown at the webpage.
At first, we will be including the Node MCU ESP8266 wifi header file and liquid crystal header file, which will be useful while connecting to a local area network and interfacing the LCD (16X2).
#include <ESP8266WiFi.h>
#include <LiquidCrystal.h>
The below code deals with the declaring the pins of the LCD and then using the liquidCrystal function to interface the lcd with the nodeMCU.
const int rs = D0, en = D1, d4 = D4, d5 = D5, d6 = D6, d7 = D7;
LiquidCrystal lcd(rs, en, d4, d5, d6, d7);
The below code declares and initializes the SSID and pass as a pointer variable of type char, and used to store the wifi SSID and Wifi password in those pointer variables. Then, start the webserver on port 80, by using the function WiFiServer server(80).
const char *ssid = "Robocraze"; // Enter your WiFi Name
const char *pass = "xxxxx"; // Enter your WiFi Password
WiFiServer server(80);
The code written in the void setup(), is used to begin the serial communication at 115200 baud rate. Then by using the SSID, password, and WiFi.begin function, we form a connection between the nodeMCU and LAN. After forming a connection with the LAN, we have to find the IP address of the nodeMCU, so that we can check the data displayed on the webpage. We can find the IP address by using the function Wifi.localIP() and print it using the serial monitor. Note that nodeMCU and your network connection should be on the same network.
void setup() {
Serial.begin(115200);
lcd.begin(16, 2);
delay(10);
Serial.println("Connecting to ");
lcd.print("Connecting.... ");
Serial.println(ssid);
WiFi.begin(ssid, pass);
while (WiFi.status() != WL_CONNECTED)
{
delay(550);
Serial.print(".");
lcd.print(".");
}
Serial.println("");
Serial.println("WiFi connected");
Serial.print("IP Address: "); Serial.println(WiFi.localIP());
server.begin();
}
After displaying the IP, we now have to handle the code which deals with the taking the input form the MQ135 gas sensor and then create that webpage and send this data over that webpage. We must also deal with refreshing the page with certain time period.
The first part of the code in the void loop deals with taking the input from the gas sensor and then printing the data on the LCD. Here, to get the input from the MQ135 gas sensor, I'm just using the analogRead command, and then by using the formula of conversion to a percentage, I found the value of the pollution content.
void loop() {
delay(500);
lcd.clear();
lcd.setCursor(0, 0);
lcd.print("Pollution=");
air_quality = ((analogRead(A0)/1024.0)*100.0);
lcd.print(air_quality);
lcd.print("%");
Serial.println(air_quality);
The below code deals with the generation of the webpage on the IP address and then transmits the data on that webpage. As the data is not of string type, we can’t send the data directly to the webpage.
At first, we need to convert the data to string type before using it to send the data on the webpage. We can convert the data to string type by using the simple command String(variable_Name).
WiFiClient client = server.available();
if ( client.connected()) { // loop while the client's connected
// HTTP headers always start with a response code (e.g. HTTP/1.1 200 OK)
client.println("HTTP/1.1 200 OK");
client.println("Content-type:text/html");
client.println("Connection: close");
client.println("Refresh: 3"); // update the page after 3 Sec.
client.println();
// turns the GPIOs on and off
lcd.setCursor(0,1);
lcd.print("Sending Data" );
// Display the HTML web page
client.println("<!DOCTYPE html><html>");
client.println("<head><meta name=\"viewport\" content=\"width=device-width, initial-scale=1\">");
client.println("<link rel=\"icon\" href=\"data:,\">");
// Web Page Heading
client.println("<body><h1 style=\"color:orange;\"> Air Quality Measurement </h1>");
client.println("<body><p style=\"color:blue;\"> Pollution Content(in percentage) = " + String(air_quality) +" %"+ "
</p>");
if(air_quality <= 20.0 ){
client.println("<body><p style=\"color:green;\"> Normal </p>");
} else if (air_quality > 20.0 && air_quality < 70.0){
client.println("<body><p style=\"color:purple;\"> Medium </p>");
} else {
client.println("<body><p style=\"font-size:200%; color:red\"> Danger!!! </p>");
}
client.println("</body></html>");
delay(1000);
lcd.clear();
lcd.setCursor(0, 0);
lcd.print("Pollution=");
lcd.print(air_quality);
lcd.print("%");
}
}
WORKING
In the beginning, the nodeMCU is operated in station mode and waits for an active LAN to connect. After connecting to a LAN, it will display the IP address by which we can visit the webpage and monitor the data. We display the IP address over the serial monitor. Note down the IP address and enter this IP address in your web browse to monitor the pollution content on the webpage.
To check the working of the MQ sensor, you can just test it by providing any gas near to it. As shown in the video below, I just used a lighter to test the working of the MQ sensor. If the pollution content is more than 20% of the maximum value, then I considered it as normal. If the value is more than 20% and less than 70% of the maximum value, then it is medium, and if the value is more than 70% of the maximum value, then it is considered as dangerous level.

COMPLETE ARDUINO CODE FOR NODEMCU ESP8266
#include  #include

const int rs = D0, en = D1, d4 = D4, d5 = D5, d6 = D6, d7 = D7; LiquidCrystal lcd(rs, en, d4, d5, d6, d7);

const char *ssid = "Mamameya"; // Enter your WiFi Name const char *pass = "244466666"; // Enter your WiFi Password WiFiServer server(80);

double air_quality; void setup() { Serial.begin(115200); lcd.begin(16, 2); delay(10);

Serial.println("Connecting to "); lcd.print("Connecting.... "); Serial.println(ssid);

WiFi.begin(ssid, pass); while (WiFi.status() != WL_CONNECTED)

{

delay(550);

Serial.print("."); lcd.print(".");

}

Serial.println("");

Serial.println("WiFi connected");

Serial.print("IP Address: "); Serial.println(WiFi.localIP()); server.begin();

}

void loop() { delay(500); lcd.clear(); lcd.setCursor(0, 0); lcd.print("Pollution="); air_quality = ((analogRead(A0)/1024.0)*100.0); lcd.print(air_quality); lcd.print("%");

Serial.println(air_quality);

//// put your main code here, to run repeatedly:

WiFiClient client = server.available(); if ( client.connected()) { // loop while the client's connected

// HTTP headers always start with a response code (e.g. HTTP/1.1 200 OK) client.println("HTTP/1.1 200 OK"); client.println("Content-type:text/html"); client.println("Connection: close"); client.println("Refresh: 3"); // update the page after 4 sec client.println();

// turns the GPIOs on and off lcd.setCursor(0,1); lcd.print("Sending Data" );

// Display the HTML web page client.println(""); client.println(""); client.println("");

// Web Page Heading client.println("
Air Quality Measurement
");

client.println("
Pollution Content(in percentage) = " + String(air_quality) +" %"+ "
"); if(air_quality <= 20.0 ){

client.println("
Normal
");

} else if (air_quality > 20.0 && air_quality < 70.0){

client.println("
Medium
");

} else { client.println("
Danger!!!
");

}

client.println(""); delay(1000);

lcd.clear(); lcd.setCursor(0, 0); lcd.print("Pollution="); lcd.print(air_quality); lcd.print("%");

}

}
Conclusion:
In wrapping up, this DIY air pollution monitoring setup using NodeMCU and the MQ135 gas sensor offers a practical and accessible way to keep tabs on air quality around us. By harnessing the power of these components, you can easily create your own pollution tracker without breaking the bank or needing advanced technical skills. The heart of the system lies in the MQ135 gas sensor, which acts like a smart nose, sniffing out different gases in the air. With just a few simple connections and basic components, you can assemble your monitoring rig. Plus, with the addition of a 16x2 LCD display, you get real-time updates on pollution levels right at your fingertips.
Thanks to NodeMCU's capabilities, your setup can connect to your home Wi-Fi network, allowing you to access pollution data through a web page it generates. By refreshing this page regularly, you'll always have up-to-date info on air quality in your area. And to make things easier to understand, the system categorizes pollution levels as normal, medium, or dangerous, giving you clear insights into environmental conditions. In essence, this project puts the power of environmental monitoring in your hands. With a little tinkering and creativity, you can play an active role in keeping your surroundings healthy and safe. Who knew DIY could be so impactful?